Performance Profiler
The Performance Profiler provides real-time monitoring of game performance metrics during gameplay.
Overview
The Performance Profiler is an in-game overlay that displays key performance metrics including FPS (Frames Per Second), frame time, and object counts. It helps developers and players monitor the game's performance in real-time.
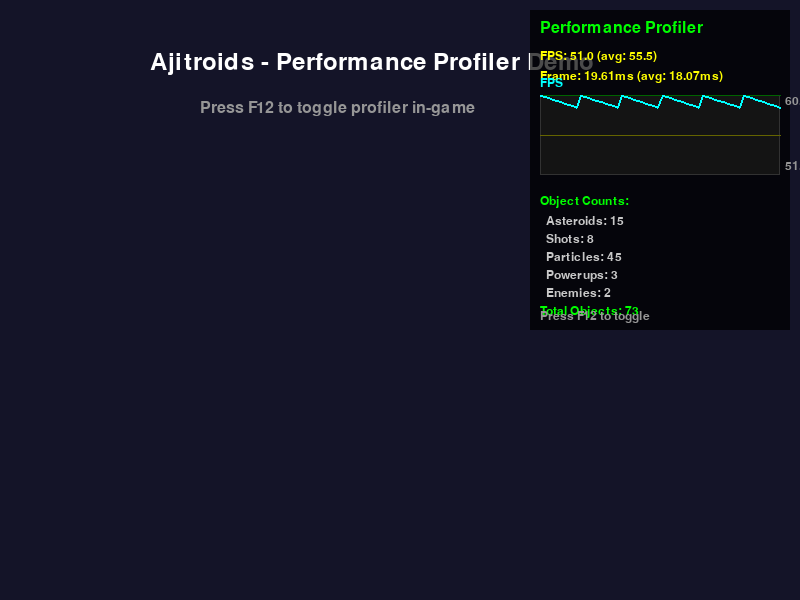
The performance profiler overlay showing FPS graph, frame time, and object counts
Usage
Keyboard Shortcut
Press F12 during gameplay to toggle the performance profiler on or off.
What it Shows
The profiler displays the following information:
- FPS Metrics
- Current FPS
- Average FPS over the last 2 seconds
-
Color-coded based on performance:
- Green: ≥55 FPS (Good)
- Yellow: 30-54 FPS (Moderate)
- Red: <30 FPS (Poor)
-
Frame Time
- Current frame time in milliseconds
-
Average frame time over the last 2 seconds
-
FPS Graph
- Visual graph showing FPS history
- Reference lines at 60 FPS (green) and 30 FPS (yellow)
-
Max and min values displayed
-
Object Counts
- Asteroids
- Shots
- Particles
- Powerups
- Enemies
- Total objects in the scene
Implementation Details
Module: modul/performance_profiler.py
The profiler is implemented as a standalone module that can be easily integrated into any pygame-based game.
Key Features
- Non-intrusive: Minimal performance impact
- Real-time updates: Updates every frame when enabled
- Historical data: Keeps last 120 samples (2 seconds at 60 FPS)
- Visual graphs: Easy-to-read performance graphs
- Color coding: Quick visual feedback on performance status
API
from modul.performance_profiler import PerformanceProfiler

# Initialize
profiler = PerformanceProfiler(max_samples=120)

# Toggle on/off
profiler.toggle()

# Update (call every frame)
object_groups = {
    'asteroids': asteroids_group,
    'shots': shots_group,
    'particles': particles_group,
    'powerups': powerups_group,
    'enemies': enemies_list
}
profiler.update(dt, clock, object_groups)

# Draw (call after all game rendering)
profiler.draw(screen)

# Get summary statistics
summary = profiler.get_summary()
# Returns: {
#     'avg_fps': float,
#     'min_fps': float,
#     'max_fps': float,
#     'avg_frame_time_ms': float,
#     'max_frame_time_ms': float,
#     'total_objects': int
# }
Integration Points
The profiler is integrated into the main game loop in main.py:
- Initialization (line ~241):
- Toggle Handler (line ~302):
- Update (line ~618):
- Draw (line ~1016):
Performance Considerations
The profiler itself has minimal performance impact:
- Only updates when enabled
- Uses efficient deque data structure for history
- Simple drawing operations with minimal overhead
- No file I/O or heavy computations
Testing
The profiler includes comprehensive unit tests in
tests/test_performance_profiler.py:
# Run profiler tests
pytest tests/test_performance_profiler.py -v

# Run with coverage
pytest tests/test_performance_profiler.py --cov=modul.performance_profiler
Tips for Developers
-
Performance Bottlenecks: Use the profiler to identify when FPS drops occur and correlate with object counts.
-
Optimization: Watch the object counts to see if particle systems or other dynamic objects are growing unexpectedly.
-
Testing: Enable the profiler during development to catch performance regressions early.
-
Target FPS: The game targets 60 FPS. Consistent frame times around 16.67ms indicate smooth performance.
Future Enhancements
Potential improvements to consider:
- Memory usage tracking (requires psutil)
- Network latency monitoring (for multiplayer)
- Draw call counting
- Custom performance markers
- Performance logging to file
- Configurable graph colors and sizes